 Beta
Graphical abstract examples by study type
These examples were drafted with MediCrab from the abstracts published on PubMed, then checked against them number by number. They are not the journals' official images. They use a 5:2 landscape canvas and are shown here at page width (see size and format). Click an image to open it full size.
| Study type | What to keep | Result shown | Limit on interpretation |
|---|---|---|---|
| Randomized trial | Population, arms and doses, primary outcome definition, events and denominators | Primary composite 10.5% vs 12.1%, HR 0.86 (95.02% CI 0.74–0.99) | No significant difference in MI, stroke or the key secondary outcome |
| Trial with a null result | Both strategies, time points, differences with confidence intervals | Five-year event rate 16.4% vs 18.2%, difference −1.8 percentage points (95% CI −4.7 to 1.0) | No evidence of benefit is not the same as proof the strategies are equal |
| Observational cohort | Exposure window, comparator drug, relative effect and estimated absolute difference | Cardiovascular death within 5 days vs amoxicillin, HR 2.49 (95% CI 1.38–4.50) | An association, not proof of cause |
| Diagnostic accuracy study | Population, index test, reference standard, sensitivity and specificity with counts | Sensitivity 98.2% (551 of 561) in smear-positive tuberculosis | Sensitivity differs by subgroup; give each with its denominator |
| Mechanism study | Pathway, animal results, type of human evidence | More atherosclerosis in mice; human cohort n = 2,595 | Animal results and human associations shown separately |
Randomized trial: population, arms and primary outcome
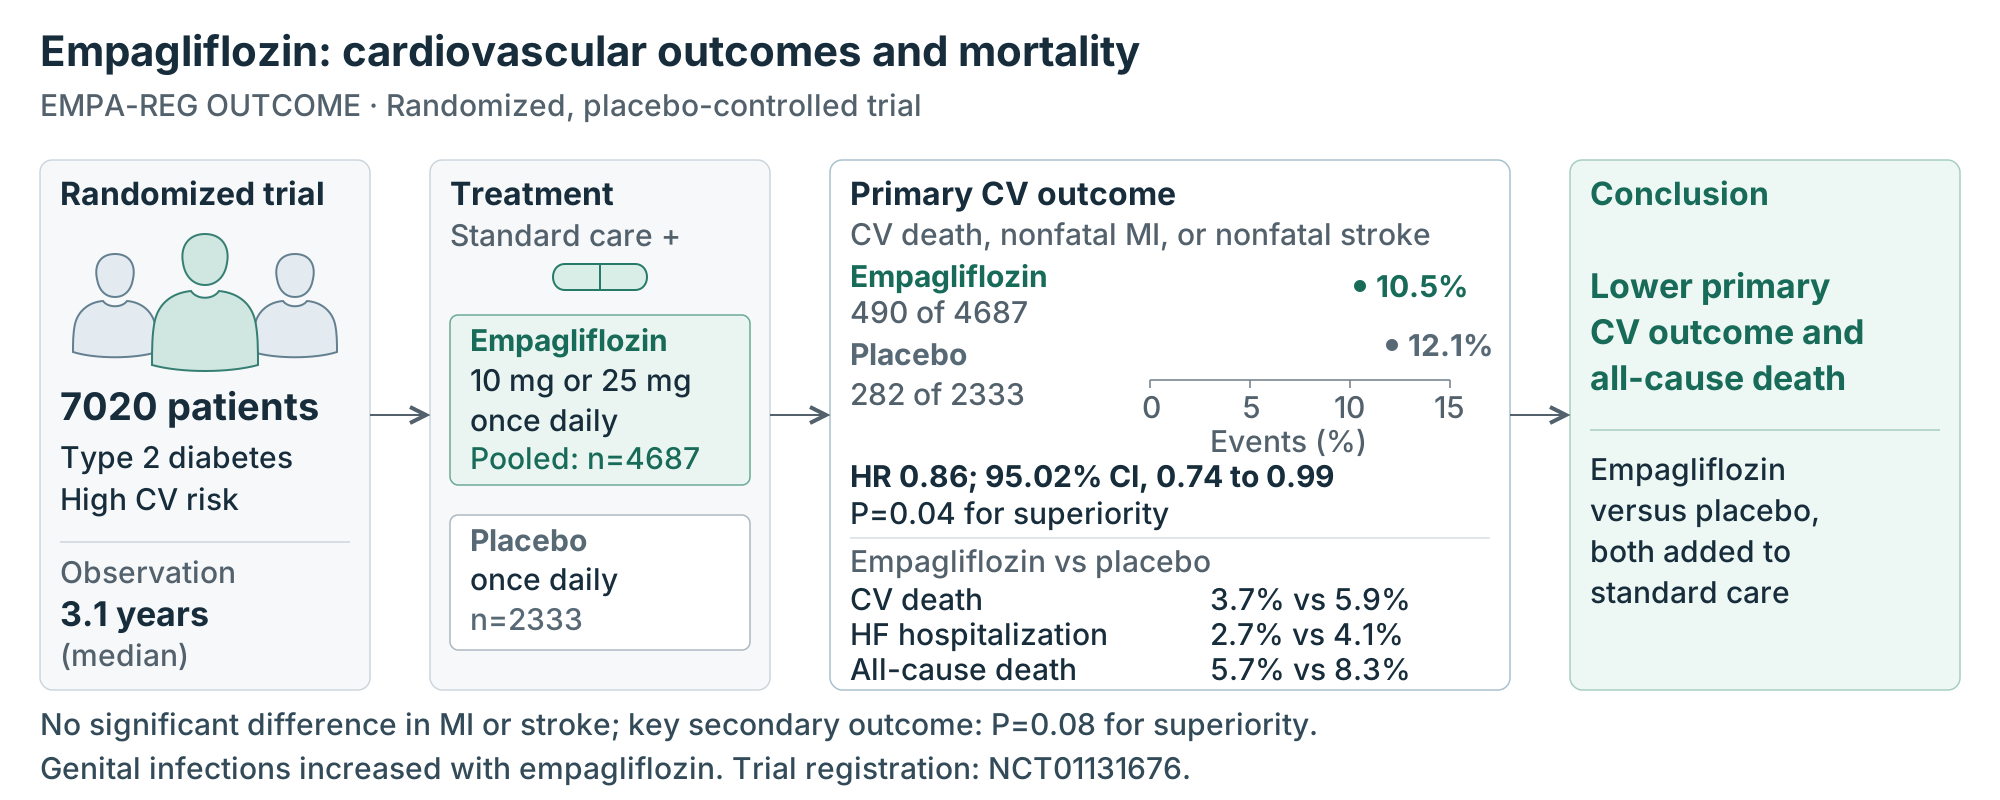
- Left to right follows the trial: population → treatment arms → primary outcome → conclusion, so readers don't have to look for the start.
- The primary outcome gets the widest panel: events, percentages, HR and confidence interval match the abstract, including the unusual 95.02% confidence level.
- Results without a significant difference are shown too: no significant difference in MI, stroke or the key secondary outcome, together with more genital infections, at the bottom.
Trial with a null result: no benefit is still a result
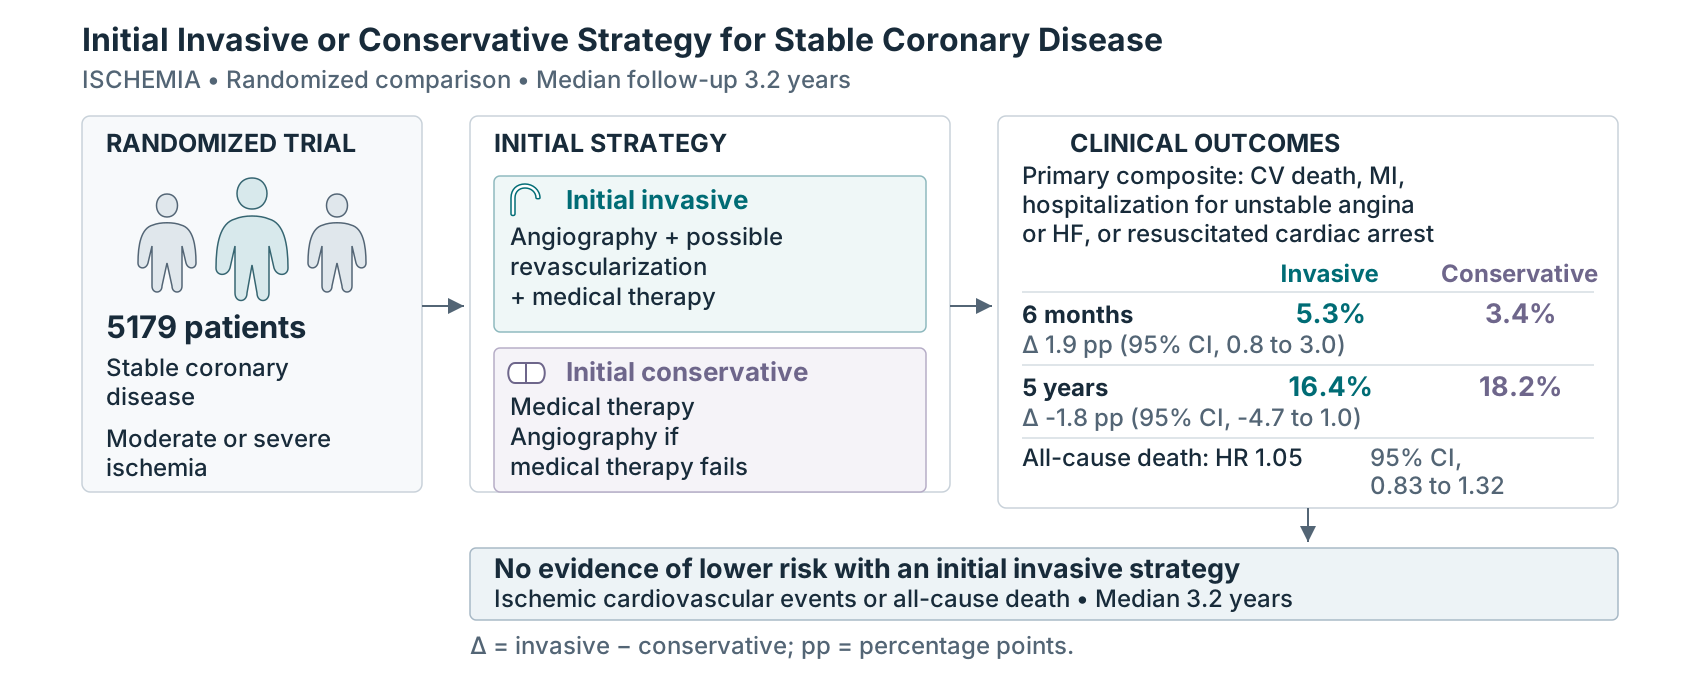
- Say what was not found: "no evidence of lower risk with an initial invasive strategy", not "the strategies are equal".
- Keep both time points: the invasive group had more events at 6 months and fewer at 5 years; showing only one would mislead.
- Give differences with their confidence intervals, so readers can see how wide the uncertainty is.
Observational cohort: comparator and absolute difference
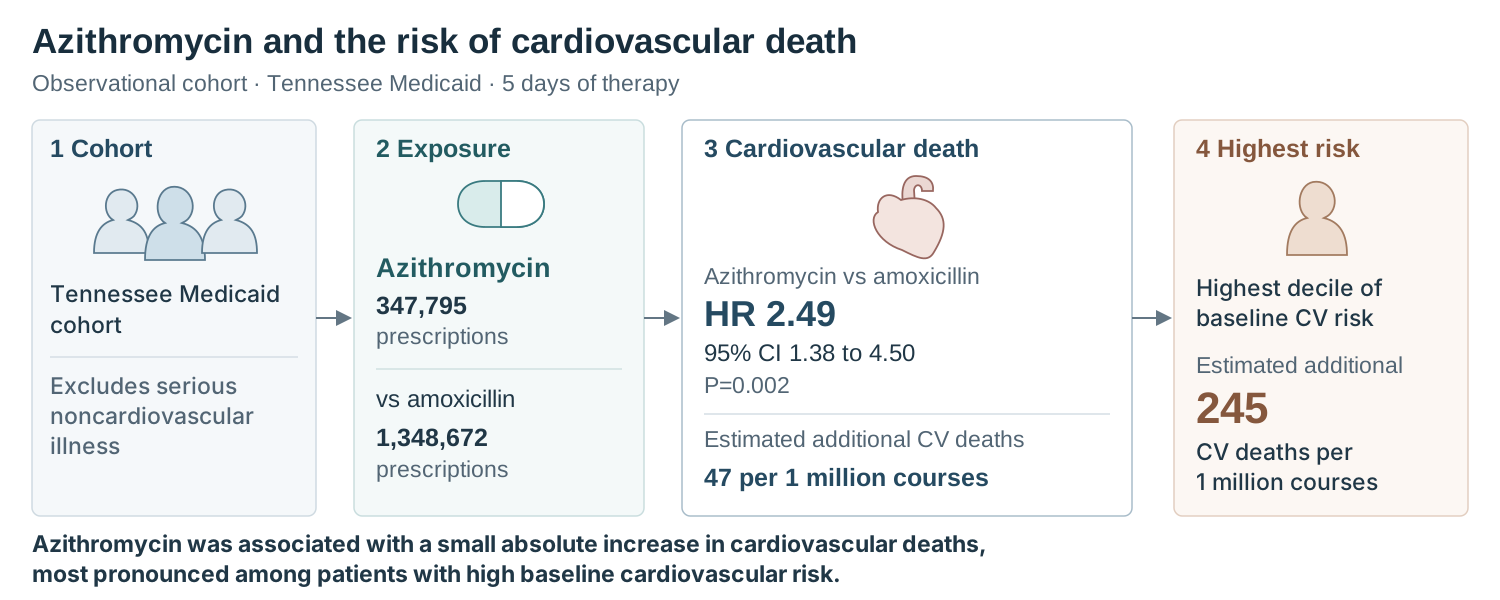
- "Associated with", not "causes": arrows show the reading order, not cause and effect.
- Relative and absolute together: HR 2.49 is the relative hazard; an estimated 47 additional cardiovascular deaths per million courses (245 in the highest-risk decile) shows the absolute difference.
- Name the comparator on the image: every number here is versus amoxicillin, so the figure says "vs amoxicillin".
Diagnostic accuracy study: test, reference and counts
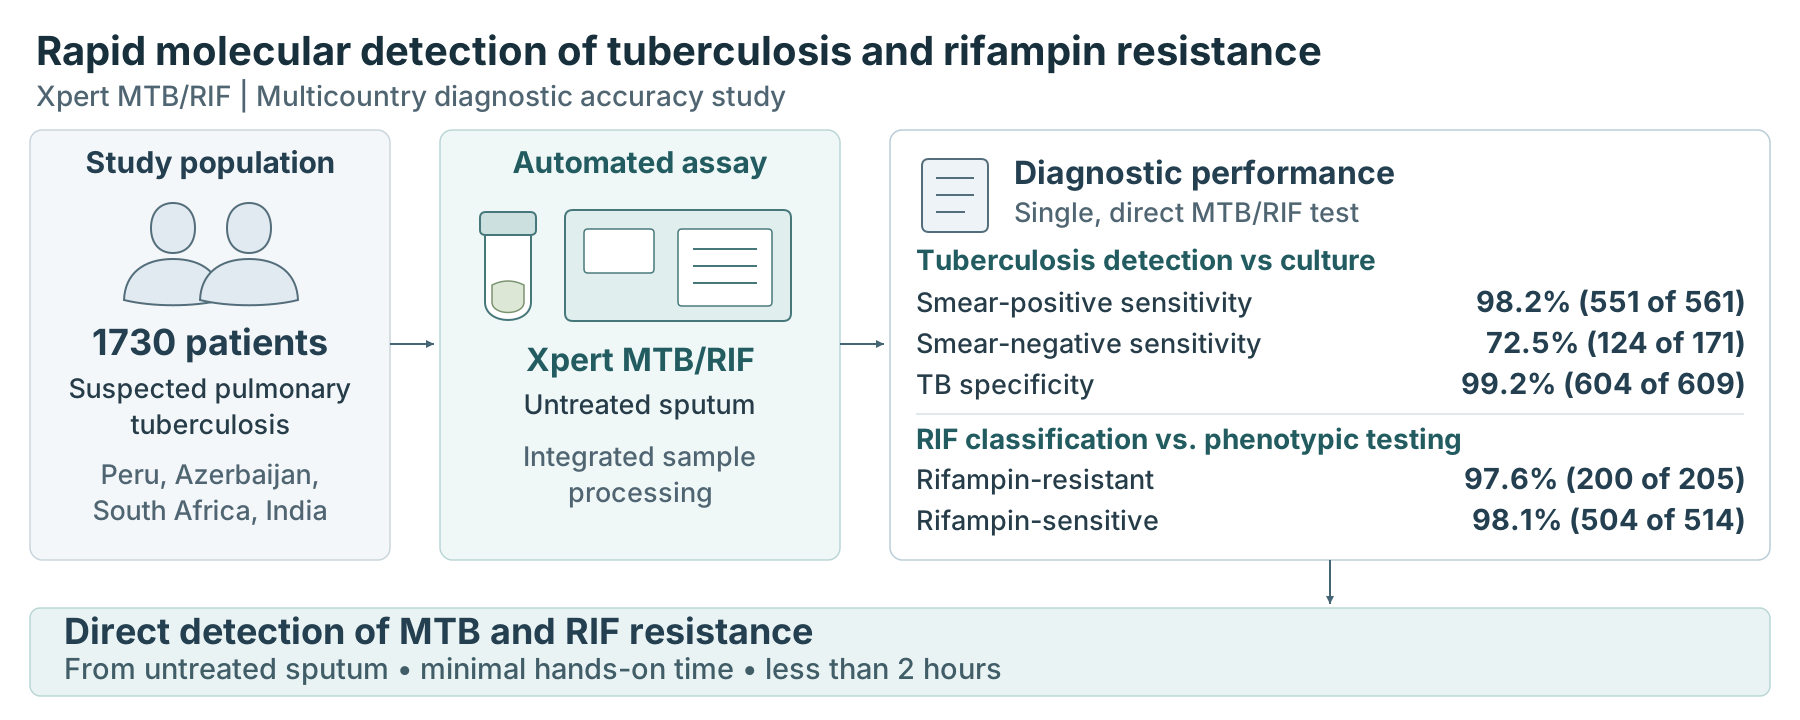
- Every percentage carries its counts: 98.2% (551 of 561) lets readers see the denominator.
- Subgroups stay separate: sensitivity in smear-negative disease (72.5%) is much lower and is shown on its own line.
- Name the reference standards: tuberculosis detection is against culture, rifampin results against phenotypic drug-susceptibility testing.
Mechanism study: animal and human evidence apart
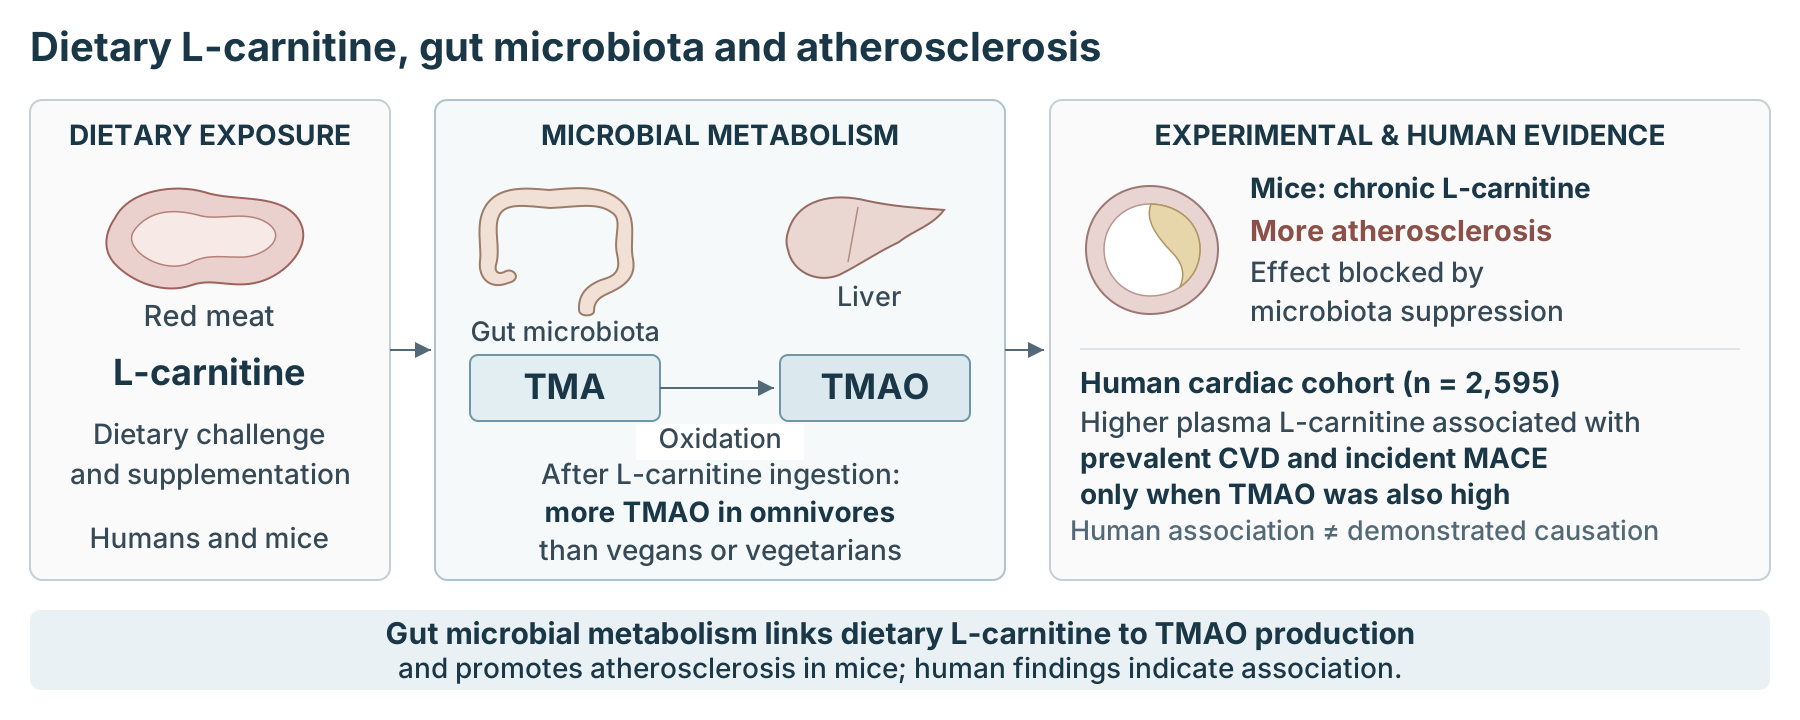
- Draw the process first: dietary L-carnitine → TMA made by gut microbiota → TMAO, each step with a simple line drawing.
- Animals and people in separate panels: the human panel says plasma L-carnitine, prevalent cardiovascular disease and incident events, and that association is not causation.
- Few numbers: only the cohort size (n = 2,595); the rest is shown with drawings.
What is a graphical abstract (or visual abstract)?
Elsevier describes it as a concise, pictorial summary of the article for an interdisciplinary audience. It is not a shrunken copy of one results figure: it links what was studied, how, and what was found in one image. Both names below mean a one-image summary; each journal decides the name and layout.
| Name | Example | Usually shows |
|---|---|---|
| Graphical abstract | Elsevier journals | Study subject, key process or mechanism, main finding, mostly as images |
| Visual abstract | Some JAMA Network journals | Population, arms and main results of a randomized trial |
Sources: Elsevier: Graphical abstract, JAMA Network: Visual abstracts.
Graphical abstract size and format
| Item | Elsevier's instruction |
|---|---|
| Size | At least 1328 × 531 pixels (width × height); larger images keep the same 5:2 ratio |
| Resolution | At least 300 dpi |
| On screen | Scaled to fit a 500 × 200 pixel window; the contents list shows it 200 pixels high |
| File type | TIFF, EPS, PDF or MS Office files preferred |
| Reading direction | A clear start and end, preferably top to bottom or left to right |
| Text | Any text or label is part of the image; no separate outline or synopsis |
| Font | Times, Arial, Courier or Symbol, large enough to read when reduced |
| Avoid | Unnecessary white space and a heading "graphical abstract" in the image |
These are Elsevier's general instructions. Other journals differ: some require a graphical abstract, some make it optional, some don't accept one. Check size, format and timing in your target journal's guide for authors.
Source: Elsevier: Graphical abstract.
Journal AI policies for graphical abstracts
Publishers are writing rules on AI and images, and they differ. Elsevier's policy says general-purpose generative AI image tools must not be used to create graphical abstracts, and encourages dedicated scientific illustration tools. For explanatory images such as flow charts, it allows AI assistance with human oversight and disclosure in the caption and the AI statement.
- Check your journal's AI policy before submitting a graphical abstract made with any AI help, and disclose the use the way the journal asks.
- An AI draft is a starting point. You choose the message, check every number and wording, and edit the layout; the finished figure is your work and your responsibility.
- If the journal does not accept AI assistance, use the draft only to plan content and layout, and build the final image in a tool the journal accepts.
How to make a graphical abstract in five steps
Have these ready: the final abstract, the main results with their outcome definitions, and your target journal's requirements.
- Write the main message in one sentence. If you can't, the image won't be clear either.
- Choose a reading direction. Trials: population → arms → outcome. Mechanisms: start → steps → result.
- Check the key numbers. Effect sizes, confidence intervals, events and denominators match the abstract; keep the comparator, time window, units and outcome definitions. Standard abbreviations are fine as long as the meaning does not change.
- Use few, precise drawings. Show the population, intervention or exposure, comparator and main outcome; add only what the conclusion needs.
- Export at the journal's size, then shrink it. If the text is still readable at contents-list size, it is done.
Common mistakes
- Numbers that don't match the abstract or text. After revisions, update the image too, and check the abstract, text, tables and image against each other.
- Observational results drawn as cause and effect. A bold arrow from "drug" to "death" reads as "causes".
- Text too small. It looks fine at full size and is unreadable in the contents list.
- The whole methods section in the image. A graphical abstract is not a second abstract.
- Only secondary outcomes or subgroups. If the primary outcome showed no significant difference, say so.
Tools for making a graphical abstract
| Situation | Approach | Still up to you |
|---|---|---|
| The journal provides a template, or your institution has an illustrator | Fill in the journal's template, or draw it in PowerPoint | Choosing the content, checking numbers |
| You need many cell, organ or other biomedical icons | A scientific illustration tool with an icon library | Layout, checking the icon licence |
| You want a first draft from your abstract | An AI drafting tool, where your journal allows it | Checking every number and the medical wording |
Drafting with MediCrab
In MediCrab's Figures, choose Graphical abstract and paste your abstract, or tell the assistant "draw a graphical abstract for this manuscript" and it works from your manuscript. The examples on this page were made this way. The draft is made with AI, so check your journal's AI policy before you submit it.
- Numbers come from the abstract or manuscript you give it. For observational studies, check that it says "associated with", not "causes".
- An editable diagram, not a painted picture: text, numbers and shapes are separate elements. Export SVG to keep editing, or PNG.
- 5:2 landscape by default; for another journal, write its size or ratio in your request.
- Limits: the drawings are simple line art, not an icon library, and not every figure gets them. Check the result against your abstract before you use it.
More on MediCrab figures.
FAQ
Is a graphical abstract required?
It depends on the journal. Some require one, some make it optional, some don't accept one. Check the guide for authors.
What size should a graphical abstract be?
Elsevier asks for at least 1328 × 531 pixels at 300 dpi, and larger images in the same ratio. Other journals set their own sizes.
Can I use AI to make a graphical abstract?
It depends on the journal. Elsevier does not allow general-purpose generative AI image tools for graphical abstracts. Where AI assistance is allowed, use it for a draft, check every number and the wording yourself, and disclose the use as the journal asks.
Is there a free way to make one?
You can draw one yourself in PowerPoint or a similar tool. MediCrab is free to download; with your own API key or Codex / Claude subscription, MediCrab does not charge, and the provider bills you as usual. Plus and Pro include a monthly allowance for MediCrab models. See pricing.